
There has understandably been a lot of talk about rain and rainfall records over the last few months. While the daily falls that Len Cook recorded in February (see previous post and also additional info at Higgins Storm Chasing) are impressive and probably unprecedented (over 2.5 metres in 11 days!), it begs the question of how many records were broken in Paluma this wet-season and just how wet Paluma is compared to other areas in the north (and elsewhere).
For those who are unfamiliar with the quote alluded to in the title of this post, the famous author Mark Twain once remarked that there are 3 types of lies: Lies, Damned Lies, and statistics. This post may serve to underscore his point that you can prove just about anything you like if you carefully choose your statistics.
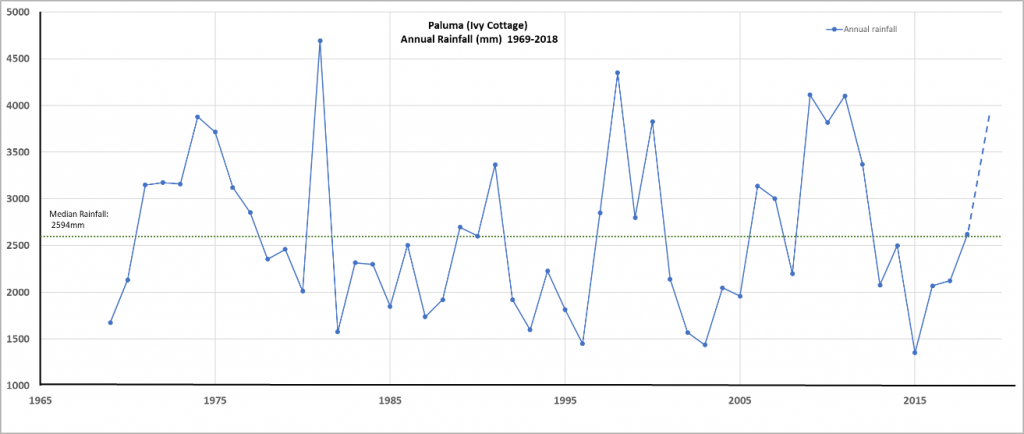
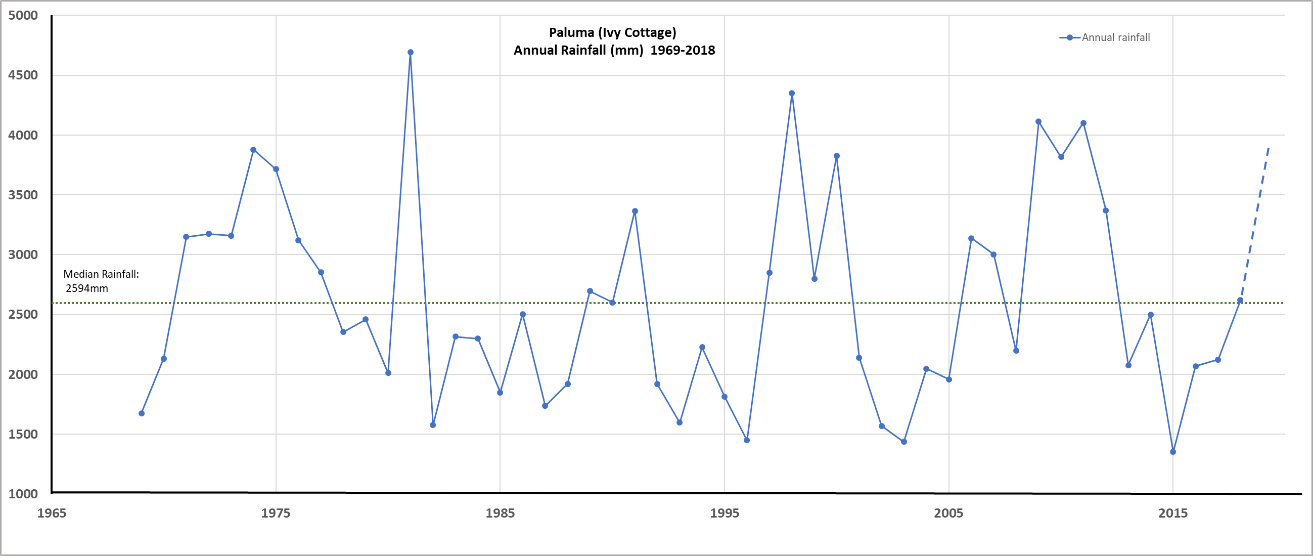
We now have 50 yrs of rainfall records for the Ivy Cottage BoM station (1969-2018) but due to some months with missing data, there are gaps in the records of annual totals. Fortunately, the late Roy Mackay kept his own records and I have been able to use his graph to fill in the missing annual totals (1992,1996-99). Lets start with how this year’s wet season in Paluma compares to the long-term record. Well, we have had the wettest February on record with 1986.7mm. In addition this wet-season from November ’18 to April ’19, even though we have no official data for April, has already been the the wettest on record with 4,636.9mm for November to March. Whether or not the 11 day accumulated total of 2571 is also a record breaker would require a deeper analysis of daily totals over the last 50 years – not something I, or anyone else detectable from a google search has been prepared to do. Nevertheless this year was a record breaking wet season in more than one way. We have already had enough rainfall from Jan-March to exceed 90% of the annual records, so there is also a reasonable chance that 2019 will be the wettest on record.
While we are discussing the long-term record for Paluma on its own, it is worth asking whether or not there have been any obvious trends or patterns in our rainfall. The graph below indicates that there has been no appreciable increase or decrease in mean rainfall over the last 50 years, but there does appear to be regular cycles of wet and dry periods with rainfall peaks separated by 7-9 years.
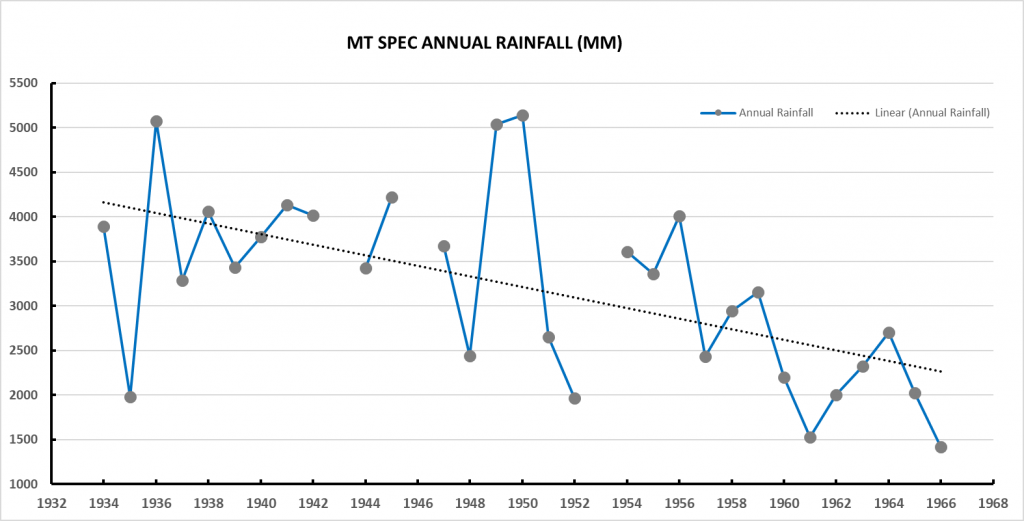
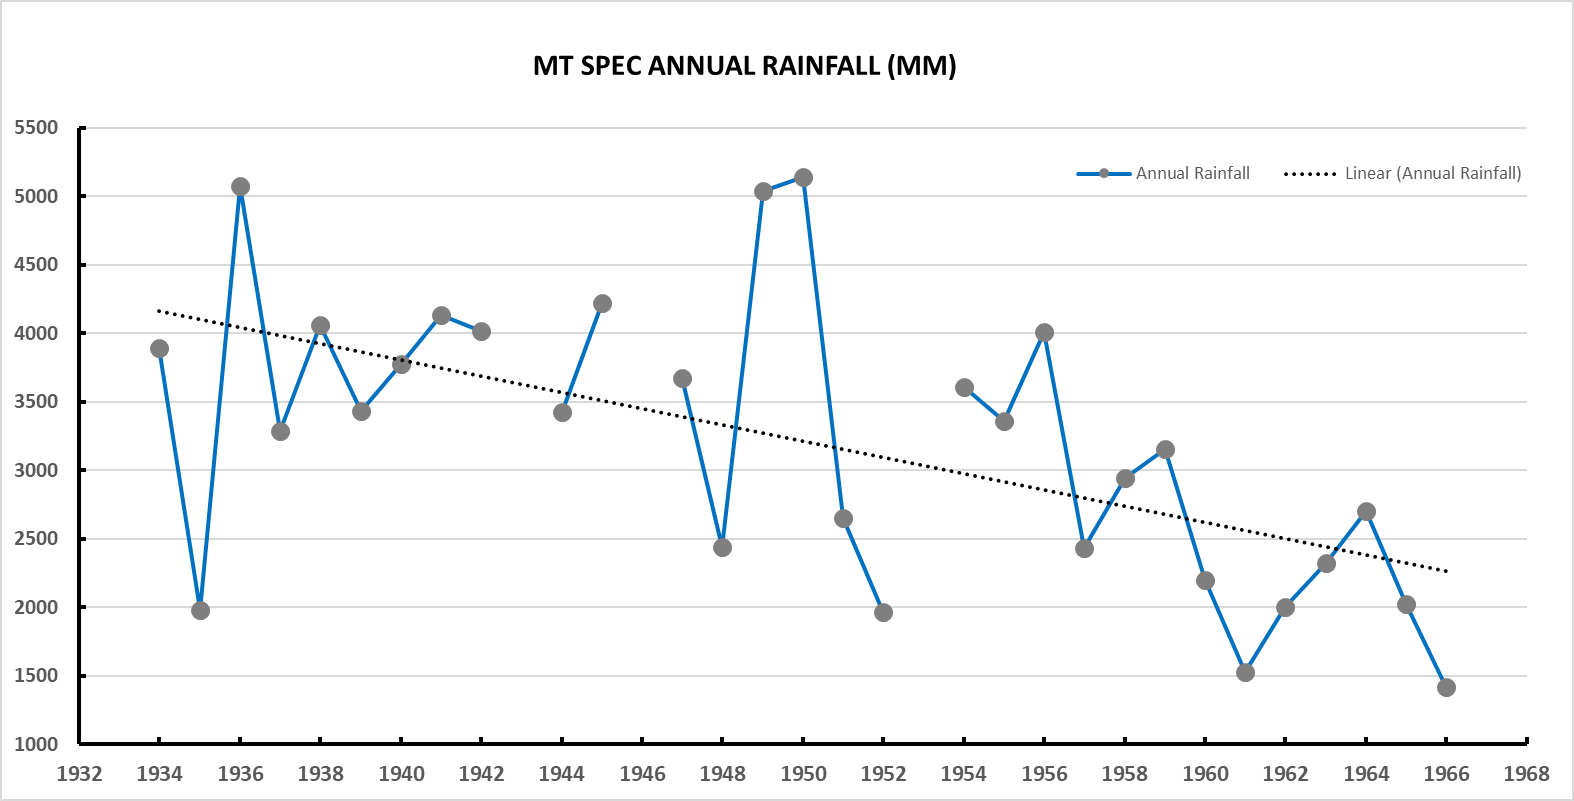
Charlie Allen recently forwarded me a graph from a now closed BoM station at Mt Spec (somewhere near the summit). The records go from 1933 to 1967 with no overlap between it and the Ivy Cottage station. Interestingly, the records indicate much higher rainfalls at Mt Spec. The median annual rainfall for the 32 years of complete data was 3324mm, which is almost a meter more than Ivy Cottage (2355mm). Also there were 8 years at Mt Spec with annual falls greater than 4m (25% of all years) and of these 3 exceeded 5m. At Paluma, we have only had 4 years exceeding 4m annual rainfall (12.5%) and none that exceeded 5m. The Mt Spec record also shows a clear decline in rainfall during the recording period. These data from Mt Spec raise the question of whether rainfall at Paluma was also higher in the 30’s to 50’s with a subsequent decline. We may never know.
Click here to enlarge
Do any of these new records mean that Paluma has toppled our two wettest towns in Australia (Babinda and Tully) off their pedestals? The short answer is no. After scratching around amongst the totals, I did find that our new record for February is higher than the highest February rainfall in Tully but not for Babinda. However I can report that our highest daily rainfall ever recorded in Paluma (634mm in January 1972) is higher than any daily totals for Tully or Babinda! Also it is possible that our recent 11 day cumulative total exceeds anything recorded there (it’s too much work to check on this!). But before we crack open a bottle of bubbly, bear in mind that having had one exceptional wet day, or series of days doesn’t really make us generally wetter than towns with much higher averages (see comparison table below). And besides, it turns out that other places in Australia have had much wetter single days – Crohamhurst in SE Qld recorded 907mm on a single day in 1893, and if we look globally, La Reunion holds the world record for daily rainfall with a staggering 1.825 metres in 24 hours.
If all of my efforts to find some way in which Paluma can be considered uniquely “wet” seem a bit over-the- top, spare a thought for Babinda and Tully.
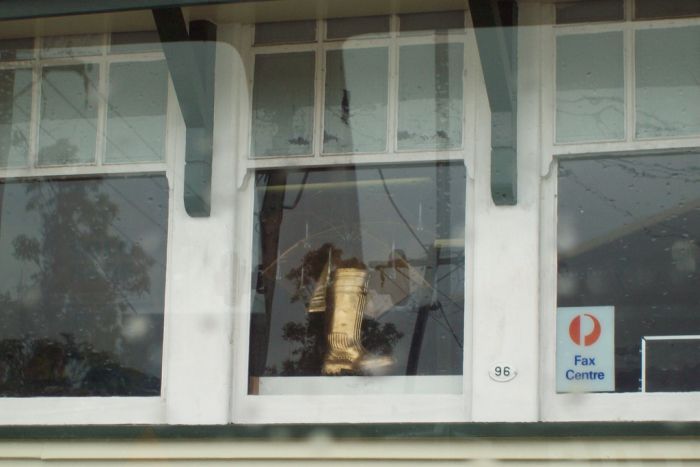
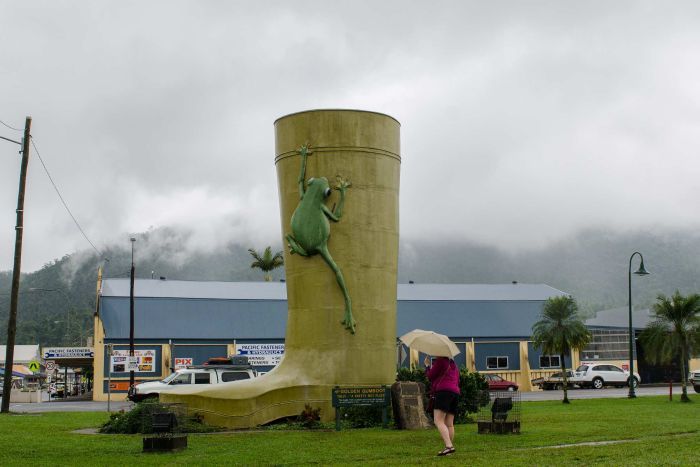
In terms of the key statistics I have seen, Babinda easily exceeds Tully in terms of average annual rainfall (4.287 vs 4.092 metres per year) and the same goes for median rainfall, making it an easy pick for the wettest town in Australia. In recognition of this humble achievement Babinda has placed a small golden gumboot in the window of its post office . Not to be outdone, Tully (in the spirit of overcompensation) has argued that it has the record for the wettest year ever (7.898m in 1950) and has erected a massive 7.9m high golden gumboot in a local green space.
Ironically neither the town of Babinda or Tully come close to being the wettest “place” in Australia. That title goes to the nearby unpopulated summit of Mt Bellenden Ker, which boasts a massive annual average of 8.12 metres and a record year of 12.46 meters in 1973. Makes Paluma seem positively arid in comparison!
| Place | Ann. Av (mm) | Ann. Median (mm) | Highest Ann. Total (mm) |
| Paluma | 2,585 | 2,355 | 4,691 |
| Tully | 4,092 | 3,914 | 7,898 |
| Babinda | 4,287 | 4,092 | 7,040 |
| Bellenden Ker | 8,121 | 7,675 | 12,461 |